X-Merge (Anatomy) is an image analysis software for biological tissues specifically designed to work with HER-2Neu specimens both in colors (brightfield) and epifluorescence.
This chapter describes the functions in the DNA Analysis dialog selectable from the Analysis menu.
All the other options in the Analysis menu are described in the chapter
dedicated to X-Plus.
The other menus are described in the chapter dedicated to X-Pro.
![]() X-Merge is identical to X-Plus
except for the added DNA Analysis dialog, which is selected from the Analysis menu. All
the functions in X-Plus and X-Pro are included in X-Merge.
X-Merge is identical to X-Plus
except for the added DNA Analysis dialog, which is selected from the Analysis menu. All
the functions in X-Plus and X-Pro are included in X-Merge.
The program is specifically designed to identify working areas on images
acquired in 2D and 3D. Inside these areas the system identifies different
typologies of cells (marked differently), which are then automatically
separated by using specific algorithms. Counts and measurement evaluations
such as Area, Perimeter, etc., are carried out on the identified cells.
Value extrapolation (also in percentage) of several cells inside different
(quantifiable) areas is extremely fast and precise. This type of examination
can be made both on color specimens (with Color
Cameras) and on fluorescence specimens (with Monochromatic
Cameras) acquiring single fields monochromatically and readapting
them as perfect pseudo-color images. Specific to fluorescence tissue specimens
are functions for spot count inside the kernels, with automatic evaluation
of the RATIO both for single fields
and for all fields acquired on the specimen. The data obtained can be
exported to Excel spreadsheets and to MS Word. Data are linked to the
database in the form of a medical
record, where all
the patient's data, including measurements, are stored at the end of the
analysis. Both data and images in the medical record can be printed with
free configuration, allowing you to generate as many different types of
printed reports as you wish. Standard image processing functions can also
be performed on acquired images.
The program can control the motor-driven 90i
and TE2000 microscopes allowing fully-automated acquisitions of different
fluorochromes and the acquisition of multiple images from different focus
planes along the Z-axis, which are then merged into single images at the
end of the process.
Once you have selected the camera type for either brightfield or fluorescence, images are acquired also with multiple acquisitions along the Z-axis and processed into merged images from the microscope's control dialog.
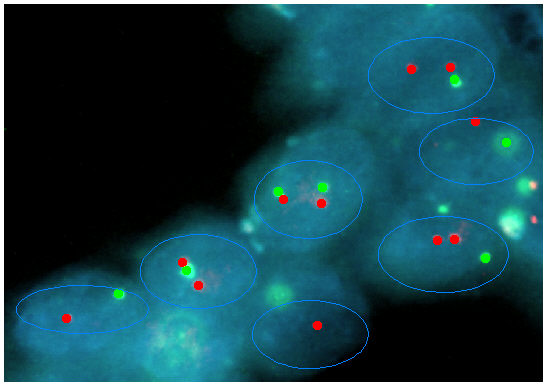
The image has two binary images, red and green, for the two types of
spots contained in the kernels identifiable with Define
Threshold.
Each region of interest (ROI)
must be defined with Define
Regions.
Prior to being analyzed the binary image can be disagglomerated and modified with the Binary Editor.
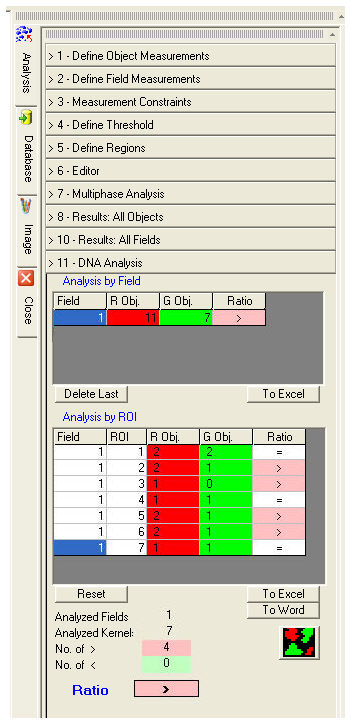
The ![]() button activates the multiphase scanning of the image.
Tables of results are displayed at the end of the process.
button activates the multiphase scanning of the image.
Tables of results are displayed at the end of the process.
For each analyzed image or Field the objects binarized in red and green and their ratios are indicated.
For each ROI in each field the objects binarized in red and green and their ratios are indicated.
The final Ratio result is the ratio of the number of ROI with more red kernels than green kernels to the number of ROI with more green kernels than red kernels.
All the analysis results and images can be sent to the active database by pressing the Save Documents button in the medical record.
From the database record you can send data and images to Word templates to generate a printable report.