 Results: all fields
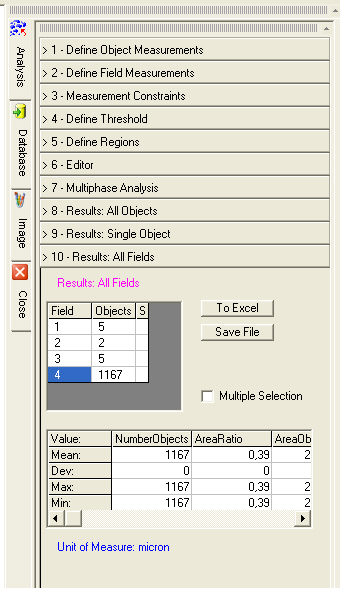
This dialog displays the statistical results over all fields for the functions selected in Define Field Measurements.
The upper table is the field table. The scanning of a region creates a new row in the table. Each row displays the progressive field number, the number of objects found and the selection, if multiple.
The lower table is the table of statistical results over the field selected
in the field table. The values shown are those of Mean,
Standard Deviation, Maximum
and Minimum for the functions
selected in Define Field Measurements.
By selecting the Multiple Selection
check box you can obtain aggregate statistical results over more fields
or phases. Indicate the rows of the desired fields in the S
column of the field table. Automatically, the statistical results for
the selected option will be recalculated.
![]() Statistical results are recalculated over selected fields.
Statistical results are recalculated over selected fields.
There are two buttons in the dialog:
To Excel: statistical data will be automatically exported to Excel, if installed.
Save File: creates a text file with the current statistical results.