Once object binarization has completed its various phases, regions have been defined, and corrections have been made with the editor, multiphase analysis can start.
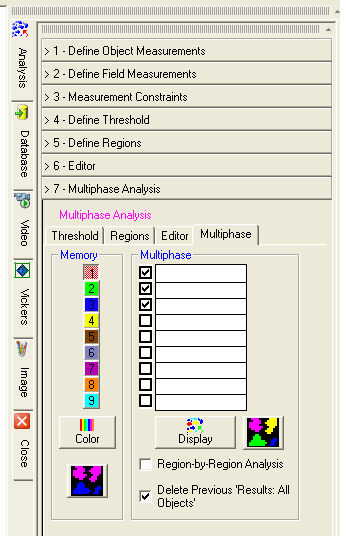
The colored buttons from 1 to 9 display the respective binary image.
The Color button allows you to
change the binarization color.
The ![]() button starts the scanning phase or image analysis
for the Current Memory
or single phase. At the end the
Results: All Objects dialog
is displayed.
button starts the scanning phase or image analysis
for the Current Memory
or single phase. At the end the
Results: All Objects dialog
is displayed.
Select in the multiphase dialog the phases to be analyzed. Text boxes can be used to indicate the Phase Description. Text written here will also be found in the Chart in the Results: All Objects dialog.
Display
Displays all binary images which correspond to the selected phases.
The ![]() button starts the multiphase
analysis of the selected phases. At the end the Results:
All Objects dialog is displayed.
button starts the multiphase
analysis of the selected phases. At the end the Results:
All Objects dialog is displayed.
Normally each single image generates several fields in the Results: All Objects table, one for each selected phase. If, on the other hand, regions consisting of several areas have been defined, these can be analyzed as distinct fields by selecting the Region-by-Region Analysis check box. For example (see figure below), if an image has three phases (colors red, green and blue) and the region of interest consists of five areas (rectangles), there will be fifteen fields of results.
Previous to a new scanning, as the multiphase analysis can generate several fields, particularly if the Region-by-Region Analysis check box is selected, it is possible to reset automatically the Results: All Objects table obtained previously.