 Results: all objects
This dialog displays all the results, including statistical data, obtained from object analysis.
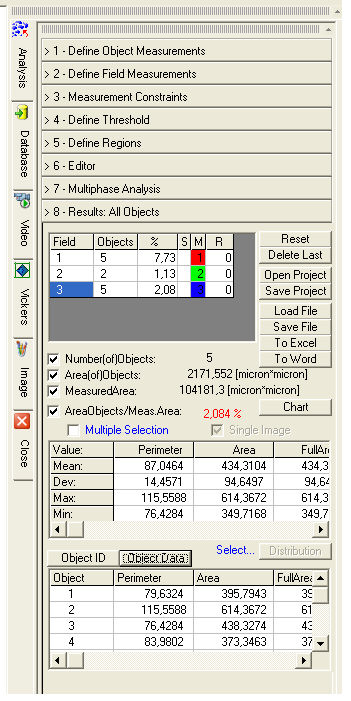
The upper table is the Field Table. Scanning a region creates a new
table row. Each row displays the progressive Field number, the number
of objects found, the ratio percentage of the total area of the objects
to the measured area of the region, the selection (when multiple), the
memory with the binarization color and the progressive number of the region
in case of a Region-by-Region Analysis.
By selecting a table row, if the analyzed image is still open, the binary
image with the analyzed objects will be displayed.
![]() The table data can be displayed with increasing or decreasing
order by pressing the left mouse button on the column title.
The table data can be displayed with increasing or decreasing
order by pressing the left mouse button on the column title.
The lower table is the Statistical Result Table relative to the field
selected in the Field Table. This table displays basic statistics (Mean,
Standard Deviation, Maximum and Minimum) calculated according to the
functions selected in Define Object
Measurements.
By selecting a column you enable the Distribution
button which displays the relative chart.
![]() The distribution chart represents the number of times a specific
result falls within a specified interval.
The distribution chart represents the number of times a specific
result falls within a specified interval.
By pressing the Object Data button
placed under the Statistical Result Table the Results: All Objects Table
is displayed.
This table displays, for each analyzed object, the results of the functions
selected in Define Object Measurements.
By selecting a table row, if the analyzed image is still open, the binary
image and its corresponding object in the binarization color will be displayed.
The other objects will appear in the negative
color.
![]() The table results can be displayed with increasing or decreasing
order by pressing the left mouse button on the column title.
The table results can be displayed with increasing or decreasing
order by pressing the left mouse button on the column title.
The Object ID button displays the
number of the corresponding object on the binary image.
By selecting the Multiple Selection
check box you can obtain aggregate statistical results over more fields
or phases. Indicate the rows of the desired fields in the
S column of the
Field Table. Automatically, the selected statistical data will
be recalculated.
Indicate the rows of the desired fields in the
S column of the
Field Table. Automatically, the selected statistical data will
be recalculated.
For example (see the figure), having selected all three fields (selected
rows in the S column), the ratio
percentage of the Total Area of Objects to the Measured Area is 27,463%
corresponding to the sum of the three percentages of the single fields.
![]() Statistical data are recalculated over the selected fields.
Statistical data are recalculated over the selected fields.
Statistical results with multiple selection can be calculated considering multiple phases on a single image or on fields belonging to multiple images. In the first case the measured area is calculated only once while in the second case it is the sum of the measured areas.
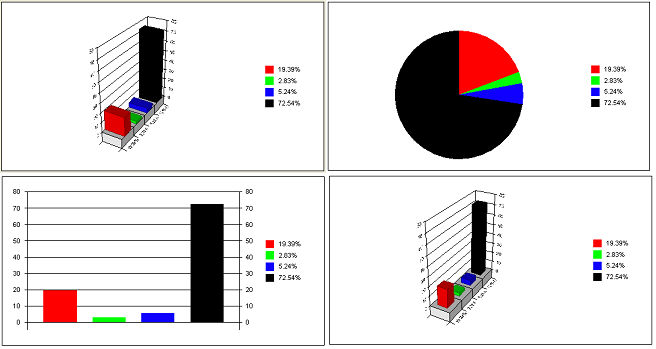
Five types of chart are available: 3D-Bar, 2D-Bar, 3D-Increase, 2D-Increase and Pie.
The legend, in addition to the percentage values, can also show text written in Phase Description.
The Apply button updates the chart legend with the text written in Phase Description.
The Copy button copies the chart to the clipboard for a subsequent Paste or Paste Special operation to generate reports.
The distribution chart represents the number of times a specific result falls within a specified interval.
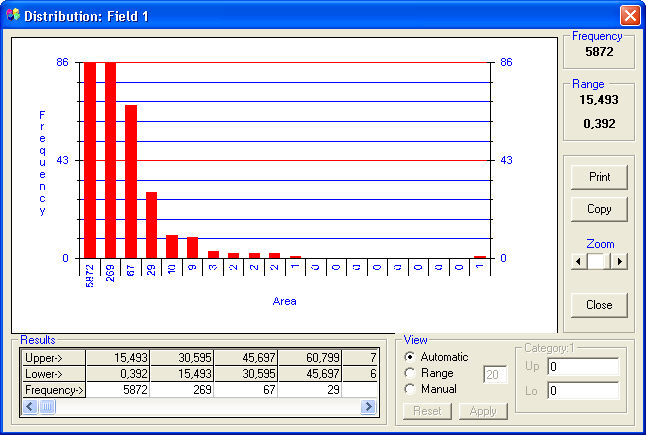
Three modes for interval selection are available:
Automatic View: 20 intervals equally divided in the range between maximum and minimum values among the results of the selected function;
Range View: number of intervals manually definable between 2 and 50 equally divided in the range between maximum and minimum among the results of the selected function;
Manual View: number of intervals manually definable between 2 and 50 and between maximum and minimum values manually selectable.
The chart can be exported to other programs by clicking on the Copy button.
The Print button generates a preformatted report which includes the chart and the frequency results for the selected intervals.
The dialog also contains the following buttons:
Reset: deletes the results of all object measurements and statistical results over all fields;
Delete Last: deletes the results concerning the last field analyzed;
Open Project: loads a work of analysis (project) saved previously. The loaded project becomes the current project;
Save Project: saves a work of analysis (project). All results of all object measurements are saved as well as all statistical results over all fields;
Load File: opens a text file of results previously saved with Save File;
Save File: saves in text format object results and statistical results over the selected field;
To Excel: if Excel is installed object results and statistical results over the selected field are transferred automatically;
Object ID: each object has its own identification number displayed in the analyzed image;
Object Data: the Results: All Objects Table is displayed.