There are 9 tabs above the table section, from Profile1 to Profile9.
The selection of the tab determines the active profile and moves to
the foreground the table with the performed measurements.
![]() To modify the name of the profile, select the tab and click
the right mouse button.
To modify the name of the profile, select the tab and click
the right mouse button.
Acquire an image and perform the measurement
with manual or automatic mode.
If the performed measurement is correct press Acquire
Test ![]() or
or ![]() .
.
The data will be sent to the open table.
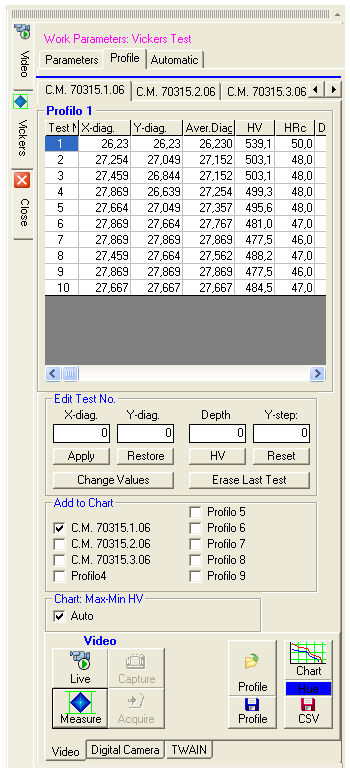 edit Test No.
Every row in the table can be modified manually. Select it with the mouse and modify the values.
Then press Apply. The data in the table will be updated.
Restore cancels the changes entered with the keyboard.
Replace with Last replaces the data in the selected row with those of the last measurement performed.
HV allows you to set a microhardness value for the test selected in the table. The diagonal lengths will be automatically recalculated and the new value inserted in the table.
Reset clears all the data in the current table.
Delete Last Test deletes the last row in the table.
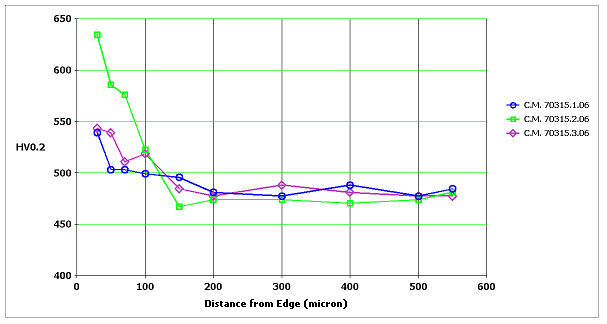
Only the selected profiles will be added to the chart.
The button displays the page for customizing
the chart.
button displays the page for customizing
the chart.
The stroke color for each profile can be customized with the Color button.
The values of the ordinates in the chart can be calculated automatically
or chosen manually in Chart: Max-Min
HV.