In automatic mode, once the measurement has been carried out, the Processing Dialog is displayed. It consists of three folders:
Zoomed
Vertices
Finds and magnifies the 4 vertices of the indentation;
Levels
Graphically displays the result of the image processing: searches for
the 4 vertices and displays the section (red path) on which the analysis
of the gray levels is undertaken;
![]() Understanding the Processing Dialog controls can optimize
the results obtained with the automatic mode of measurement.
Understanding the Processing Dialog controls can optimize
the results obtained with the automatic mode of measurement.
Advanced
Selects the type of analysis.
![]() Understanding the Processing Dialog controls can optimize
the results obtained with the automatic mode of measurement.
Understanding the Processing Dialog controls can optimize
the results obtained with the automatic mode of measurement.
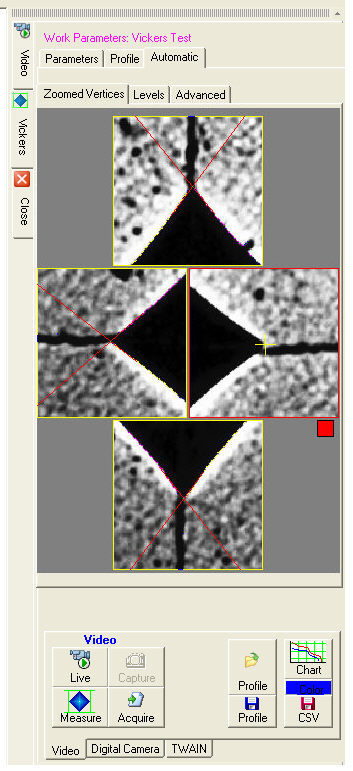
Finds and magnifies the 4 vertices of the indentation.
Vertices can be changed manually:
point to the new position
and click the left mouse button. A red square ![]() will appear
next to the image to indicate that the new measurement will be performed
according to the manual position you have entered.
will appear
next to the image to indicate that the new measurement will be performed
according to the manual position you have entered.
point to the other vertices to be modified manually.
press the ![]() button to obtain the new measurement. The border of the manually
modified image will be colored red.
button to obtain the new measurement. The border of the manually
modified image will be colored red.
By pointing to the red square and clicking the left mouse
button the automatic mode in the Processing Dialog will be restored.
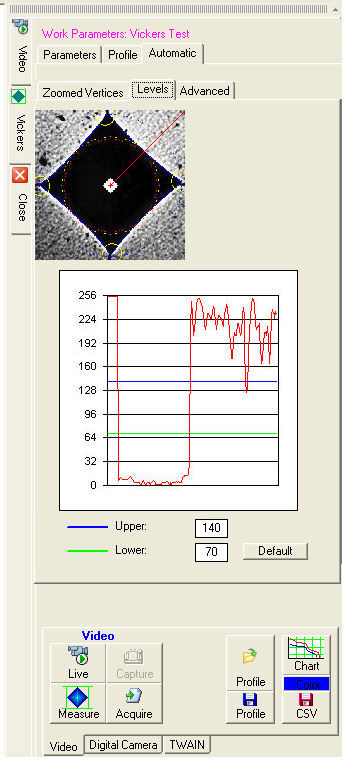
Graphically displays the gray levels along the section (red path in the Preprocessing image).
In the Preprocessing image the four yellow circles represent the four zones the image analysis has indicated as containing the four vertices of the impression.
In the Levels dialog, the red curve in the graph displays the gray levels starting from the center of the indentation. Initially the value is 256, representing the white center of the impression as displayed in the Preprocessing image.
Then the levels decrease and keep close to the zero inside the impression (the dark area in the Preprocessing image).
When the edge of the impression is reached the line quickly goes up and once past the edge it varies according to the type of surface.
The program tries to calculate automatically the optimal position for the Upper (blue) and Lower (green) horizontal threshold lines.
For the program to function correctly the two threshold lines need to be positioned so as to contain, inside the impression (dark area), only the descending and the ascending segments of the red curve, as shown in the figure below.
In some cases it may be necessary to modify manually the position of the two threshold lines by acting on the respective numerical values.
Press the ![]() button to obtain a new measurement.
button to obtain a new measurement.
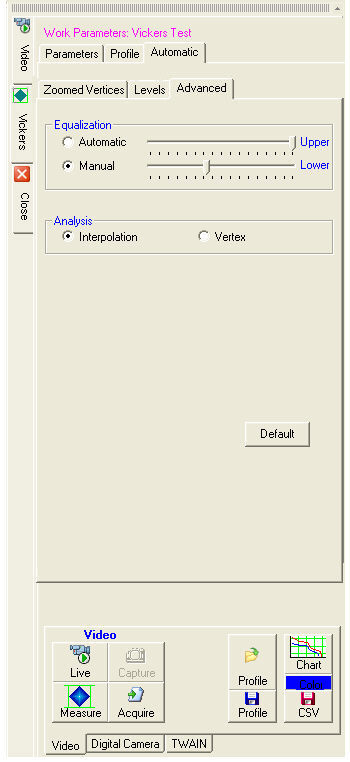
Equalization
The Equalization controls allow you to modify the image contrast.
The Equalization control is off if:
the Upper slider is all to the right;
the Lower slider is all to the left.
Drawing the two sliders nearer to each other increases the image contrast.
Analysis
by Interpolation
This is the standard (default) mode. The
program singles out the vertices from the intersection of the two segments
which interpolate the edges of the impression in the proximity of the
vertices.
![]() This mode allows you to perform
the automatic measurements even without a vertex.
This mode allows you to perform
the automatic measurements even without a vertex.
Analysis by Vertex
This mode searches for the vertex at
the pixel (maximum gradient).